


Quadrophenia was the sixth studio album by the English hard rock band The Who. The double album was released in October 1973 and was the group's rock opera follow-up to the massively successful Tommy, released four years earlier. Set in London and Brighton in 1965, the story follows a young man as he searches for identity, self-worth, and importance. Quadrophenia is the only Who album that was entirely written and composed by Pete Townshend.
Source: Amazon.com
"The Real Me" is the second song on the album. It tells the story of Jimmy, a young English Mod with four distinct personalities. The song describes how he angrily deals with several individuals, including his doctor, psychiatrist, mother, and preacher, who all try to help him identify "the real me."
For those of you who are not familiar with this song, which includes an amazing bass performance by John Entwistle, I have included a YouTube link to the song below.
It is also essential to understand the rate of return of your investments in “real terms.” From an economic standpoint, real rates of return are measured by taking your gross or nominal rate of return and subtracting the rate of inflation. This gives you the “real growth” of your assets and tells you how much additional purchasing power has been created over and above the cost of living.
Your real or absolute rate of return is crucial. It tells you how much more in the way of groceries, gasoline, meals out, or plane tickets you can buy now than you could have before investing your money. It has often been said that stocks, or equities, provide the best opportunity to create real compounded growth of your investment assets. Many asset classes, such as money market funds, treasury bills, and bonds, have provided little growth, net of inflation, over long periods of time.
A recent report from Advisor Perspectives showed how well the three main US stock market indexes, the Dow, the S&P 500, and the NASDAQ, had beaten inflation over the last 24 years since the stock market peaked in early 2000, as we hit the zenith of the tech bubble. A summary chart showing the overall indexes in both nominal and real terms is provided below. Just to let you know, the returns listed below do not include dividends.
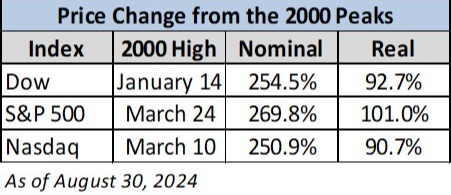
Source: advisorperspectives.com
So, what does this really mean to you and your invested dollars? From our second chart below, you will first notice that the time period you measure matters. This chart measures the market from its early 2000 peak through the end of August 2024. This encompasses the two most significant stock market downturns we have experienced since the Great Depression. These coincided with the recessions during the bursting of the dot.com bubble and the events of 9/11, as well as the failure of AIG/Lehman Brothers during the Great Financial Crisis, which led to government bailouts.
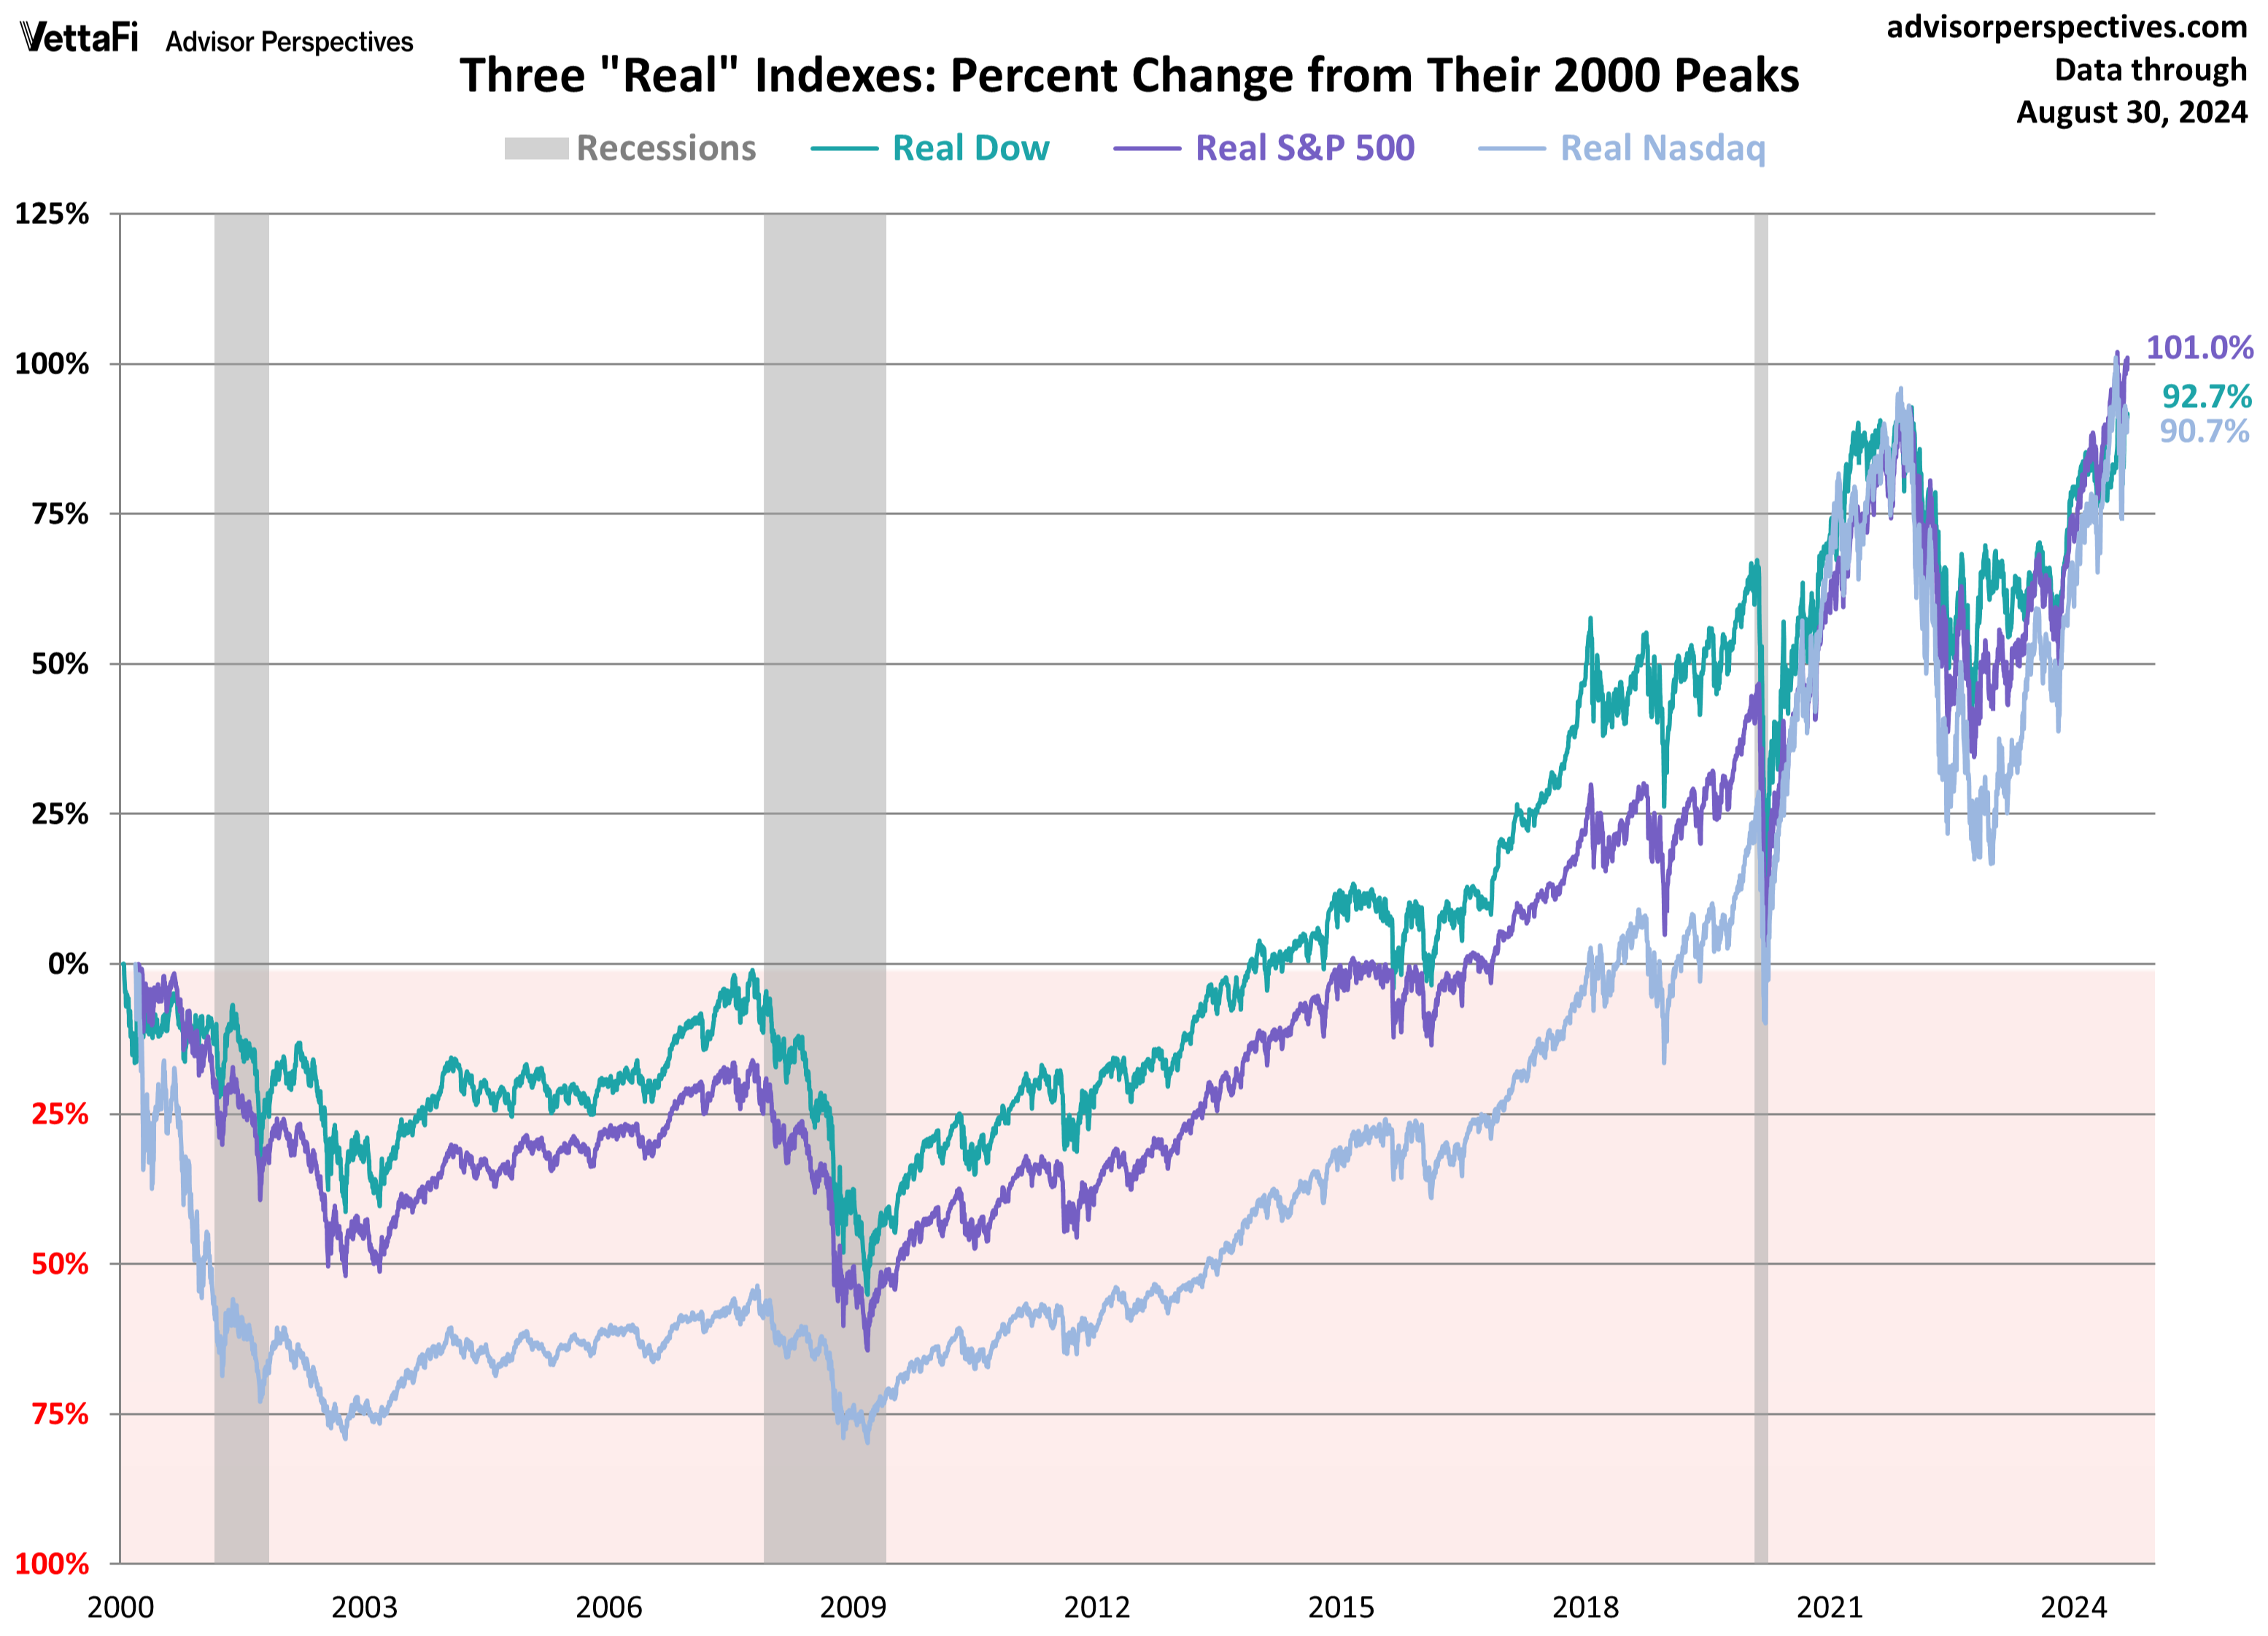
Source: advisorperspectives.com
The chart above shows that the NASDAQ, represented by the light blue line, dropped the most in the aftermath of the internet bubble bursting. Because of this and the persistent effects of inflation, this tech-oriented index did not return to positive “real” returns until nearly 2017. Seventeen years is a long time to stay patient and invested in an asset that is not keeping up with the cost of living.
Please remember that this index contains most of the tech and AI names that generate so much attention in the financial media and online blogs today. This can lead to significant ups and gains, but it can also lead to long periods of underperformance, as pictured above.
At the end of the day, all three indexes ended up in a similar place. They just took different paths to get there. This supports the ongoing argument for staying diversified and rebalancing portfolios regularly.
Finally, I want to share with you what this means in actual dollar terms. Let's review how $1000 invested in the S&P 500 index at its market peak on March 24, 2000, would have grown in both nominal and real terms. Please remember that both the markets and the index experienced significant volatility and downturns throughout the measured period.
We begin with the 47% drop during dot.com and the 9/11 downturn, which was followed by the 57% decline during the Great Financial Crisis. We also experienced a 20% drop in the fourth quarter of 2018, a 34% decline in February/March of 2020 as we entered the COVID economic lockdowns, and a 26% drop in 2022 as Russia invaded Ukraine and the Fed began raising interest rates aggressively. This means we lived through five separate 20% plus market downturns in the last 24 years.
However, despite all the market volatility and economic dislocation, $1000 invested in the S&P 500 index would have grown more than fivefold to $5357 at the end of August. After the effects of inflation, the same $1000 would have grown to $2913. This results in you being able to buy nearly three times more of the things you purchase daily if you had enough faith, patience, and discipline to stay invested for the entire 24 years.
Jimmy, the troubled mod teen in the rock opera Quadrophenia, is desperately trying to find “The Real Me.” However, the clients of Impel Wealth Management are trying to find REAL ways for their hard-earned assets to allow them to enjoy life over a 20 to 30-year retirement life expectancy. Understanding how various investment asset classes have performed relative to both economic volatility and inflation is one of the ways we keep life “Moving Life Forward” for you.
© 2024 Jesse Hurst
Senior Wealth Manager
The views stated are not necessarily the opinion of Cetera and should not be construed directly or indirectly as an offer to buy or sell any securities mentioned herein. Due to volatility within the markets mentioned, opinions are subject to change without notice. Information is based on sources believed to be reliable; however, their accuracy or completeness cannot be guaranteed. Past performance does not guarantee future results.
Neither Cetera Advisors LLC nor any of its representatives may give legal or tax advice. This information is not intended as tax or legal advice. Please consult legal or tax professionals for specific information regarding your individual situation.
Investors cannot directly invest in indices.
The performance of any index is not indicative of the performance of any investment and does not take into account the effects of inflation and the fees and expenses associated with investing.
Featured blog image source: iStock.com/tumsasedgars