


"Rock and Roll" is a song by the English rock band Led Zeppelin, released as the second track on their fourth studio album in 1971. According to guitarist Jimmy Page, the song developed from a spontaneous jam session that occurred after the band became frustrated while attempting to finish recording a different song. During a break, John Bonham began playing the drum intro to the 1957 song "Keep A-Knockin'" by Little Richard, to which Page added a Chuck Berry-style guitar riff. The rest of the band members reportedly joined in "one by one." The tapes were rolling, and after improvising the first section of the song, the basis of the rest of the song was completed in around fifteen minutes.
Source: Rhino.com
Even though the song is titled “Rock and Roll”, many people identify the song with the lyrics from its chorus:
It's been a long time, been a long time
Been a long lonely, lonely, lonely, lonely, lonely time
If you are unfamiliar with this song or are looking for a morning pick-me-up, a YouTube link to the original recording is included below. It works best if you turn it up really loud.
Led Zeppelin - Rock and Roll (Official Audio)
For investors who have been waiting and hoping for the international stock portion of their portfolio to outperform its U.S. stock counterparts, it has undoubtedly been “a long lonely, lonely time”. You see, US and global stocks tend to go through long cycles where one outperforms the other.
When I started my career as a financial advisor in the fall of 1987, foreign stocks were on a tear. They started significantly outperforming U.S. stocks in 1985, and this outperformance continued through the end of the decade, as you can see in our first chart below from our friends at Hartford.
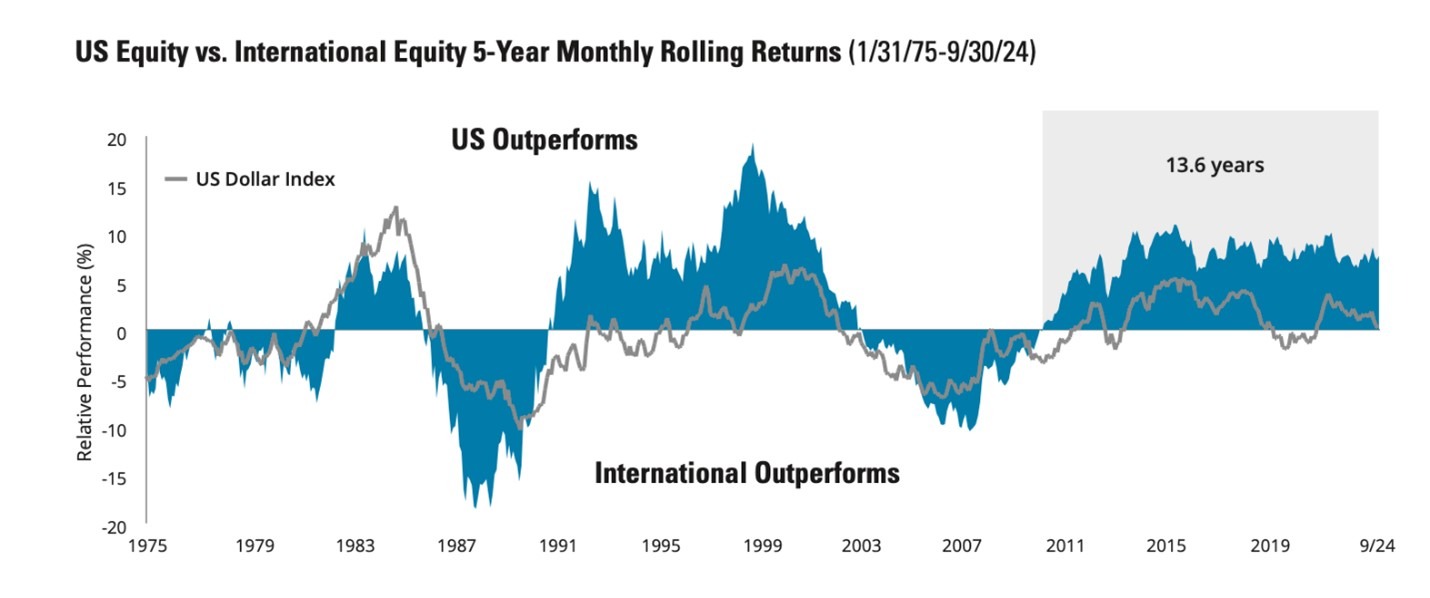
Source: Hartford Funds – US and International Markets Have Moved in Cycles
Much of the excitement was being driven by the potential formation of the European Union and the future creation of a new currency, the euro. As a matter of fact, in the early days of my career, many economists and market strategists were suggesting that foreign stocks make up 50% or more of the equity exposure in your portfolios. The foundation for the EU was laid over several decades. However, the formal creation of the European Union occurred on November 1, 1993, with the implementation of the Maastricht Treaty, which had been signed in 1991. The euro currency was officially introduced on January 1, 1999, as a non-cash monetary unit. Initially, its use was limited to electronic payments and accounting purposes. Physical euro coins and banknotes didn't enter circulation until January 1, 2002. At that time, they replaced the national currencies of the participating countries.
You will also notice that U.S. stocks substantially outperformed international stocks during the dot.com boom of the mid-to-late 1990s. Following the bursting of the dot.com bubble, the events of 9/11, and the Enron/WorldCom debacle, foreign stocks experienced a cycle of outperformance that lasted until the end of the decade, when the subprime mortgage mess and the Great Financial Crisis occurred. However, since that time, the United States has clearly had the homecourt advantage in portfolio construction and performance. This has been driven by technology companies, and more recently by AI companies, which have leveraged their size, scale, and low interest rates to create dominant brands with strong and growing corporate earnings.
It has surprised many economists and investors that, amid the economic and geopolitical uncertainty experienced this year, the foreign stock portion of their portfolios has risen significantly. In contrast, U.S. stocks have barely broken even and experienced a nearly 20% downturn from mid-February to early April of this year. After waiting “a long, lonely, lonely time”, those who maintained disciplined diversification in their portfolios are being rewarded for their patience.
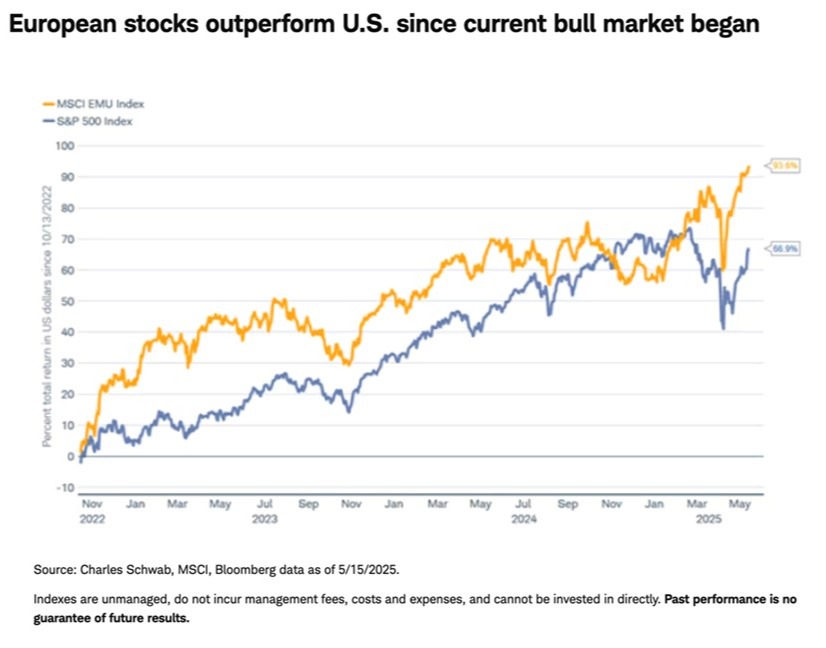
International stocks have soared this year while financial headlines have screamed about the end of US exceptionalism, the decline of the US dollar, and the end of globalization amidst trade and tariff uncertainty. What may surprise many of our friends and clients is that the trend of international stock outperformance actually began with the start of the new bull market in October 2022, as you will see in our next chart below. Over the preceding 9 1/2 months of that year, stocks around the globe declined by more than 20% as Russia invaded Ukraine and the Federal Reserve Bank began its most dramatic interest rate increase campaign in more than 40 years to combat persistent and rising inflation.
The team at Charles Schwab uses a shark chart analogy to demonstrate the long cycles of underperformance in US and international stocks. They postulate that investors face risk if they are overallocated to the asset class that has recently outperformed when the trend starts to change. Historically, at the beginning of each new cycle, the current trend reverses. The leaders of the last cycle tend to reverse, and the previous laggards become the new leaders. In our final chart, you will see when the orange line is rising, indicating that U.S. stocks are outperforming, as they did during the 1990s and the 2010s. When the blue line is rising, international stocks are outperforming as they did in the 1980s and the 2000s.
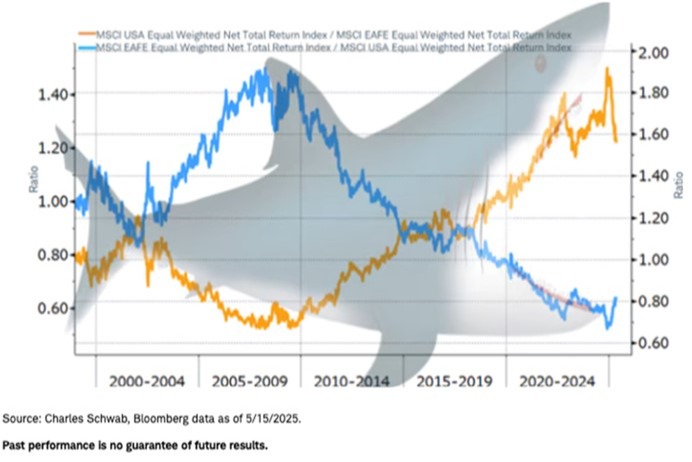
As you can see, once the trend reverses, it tends to persist for several years. Of course, past performance is no guarantee of future results. However, we may still be in the early part of this cycle, as the past trend of US outperformance lasted for many years and resulted in a wider disparity of performance and valuation than we had seen in many decades. Therefore, it may not be too late to review your allocation to make certain that you have adequate exposure to foreign stocks in your portfolio.
In Part 2 of this series, I will explore some of the trends that are driving this recent reversal in asset class performance. This includes structural factors such as the geopolitical backdrop, government spending, and stimulus, as well as, importantly, historical valuation metrics. It has undoubtedly been “a long, lonely, lonely time” since international stocks have pulled their weight in our diversified portfolios. The CFPs of Impel Wealth Management have been monitoring the current trend and wanted to keep you informed about this important topic as we continue “Moving Life Forward.”
© 2025 Jesse Hurst
Senior Wealth Manager
Related Content
- Alive and Kicking...International Stocks Part 2
- How Long Could They Da Do Ron Ron? International Stocks Part 3
The views stated are not necessarily the opinion of Cetera and should not be construed directly or indirectly as an offer to buy or sell any securities mentioned herein. Due to volatility within the markets mentioned, opinions are subject to change without notice. Information is based on sources believed to be reliable; however, their accuracy or completeness cannot be guaranteed. Past performance does not guarantee future results.
Additional risks are associated with international investing, such as currency fluctuations, political and economic stability, and differences in accounting standards.
Neither Cetera Advisors LLC nor any of its representatives may give legal or tax advice. This information is not intended as tax or legal advice. Please consult legal or tax professionals for specific information regarding your individual situation.
Featured Blog Image Source: iStock.com/iosebi meladze